What I Learned Tracking CPG Financial KPIs: A Brand Manager’s Success Story
 CPG financial metrics changed our brand’s path in an industry expected to reach $18.94 trillion by 2031. My first days as a brand manager taught me that evidence-based decisions weren’t just helpful—they were vital to survive in the competitive CPG space.
Financial KPIs guided us through market challenges. The CPG industry will add $3.18 trillion in value in 2024 alone. Brands that track performance indicators consistently can capture more market share. Our team learned that metrics like gross margin and cash conversion cycle gave us vital explanations to optimize our CPG financial model.
This piece details my trip to implement financial KPIs in our organization. We faced challenges with data systems. Velocity metrics helped us avoid getting pricey stockouts while maximizing profitability. These lessons changed our financial performance and approach to supply chain management and marketing campaigns completely.
How I Started Tracking Financial KPIs in My CPG Role
My trip into CPG financial metrics started with a revelation. Our brand made critical decisions based on instinct rather than insight. The implementation of financial visibility wasn’t exciting, but it proved vital to our survival.
Understanding the need for financial visibility
Our team struggled to explain fluctuating profits despite steady sales growth. Data isn’t a luxury in the hypercompetitive consumer goods market—it’s a necessity. Our brand needed reliable indicators to guide strategic decisions in manufacturing, distribution, and sales operations.
Financial visibility removes guesswork by providing concrete data about your business’s performance. To name just one example, a product line showed declining margins despite increasing volume. We couldn’t pinpoint the cause without proper metrics. The lack of measurable KPIs left us navigating blindfolded.
Choosing the right KPIs for our brand goals
Building our CPG financial model started with identifying core objectives. We focused on metrics tied directly to strategic priorities instead of tracking everything possible. Market share growth, customer satisfaction improvement, and profitability boost became our priorities.
The team arranged priorities across departments:
- Sales team focused on units sold and market share
- Marketing monitored ROAS and customer acquisition cost
- Operations tracked inventory turnover and on-time delivery
Stakeholder cooperation proved vital during this phase. As one document noted, “When evaluating these factors and selecting KPIs, it’s critical to collaborate with various business units”. This cross-functional approach prevented siloed thinking and created shared ownership of our financial metrics.
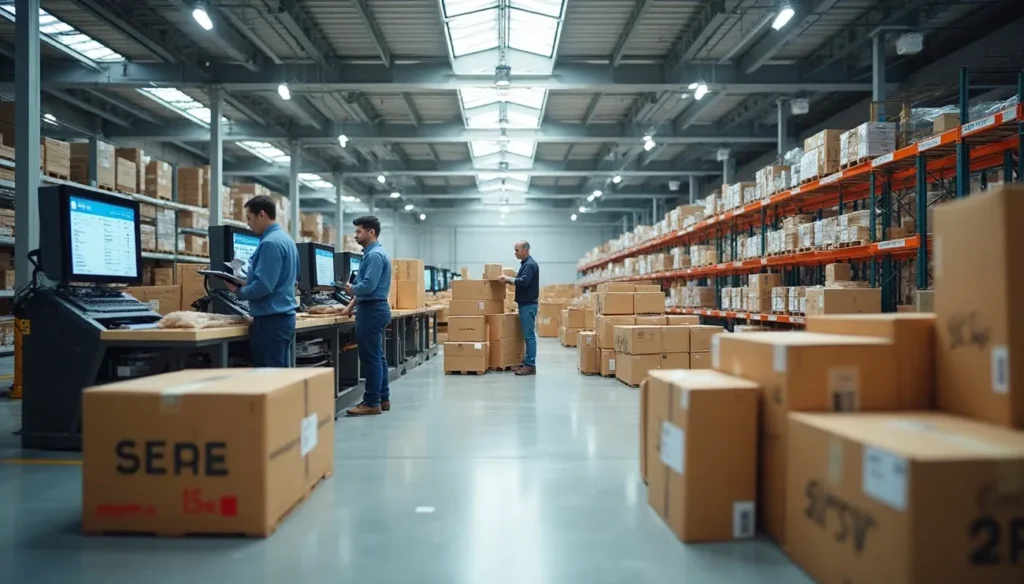
Initial challenges with data and systems
The implementation of financial KPIs wasn’t smooth sailing. The complexity of our supply chains made inventory tracking difficult, especially with multiple distribution and retail partnerships.
Data integration became our biggest problem. We struggled to maintain consistent reporting standards without a centralized data management system. So, KPI measurements varied across departments and created confusion and mistrust in the numbers.
Manual reporting wasted valuable resources that could serve better purposes. This led us to explore ERP systems and business intelligence platforms. These tools automated KPI monitoring and measurement, which helped us implement analytical strategies effectively.
The 4 KPI Categories That Transformed Our CPG Strategy
Our brand’s financial visibility implementation helped us find four KPI categories that changed everything. These CPG financial metrics are the foundations of our decision-making process.
Sales and revenue metrics
Sales velocity became our north star metric that measures how fast products move off shelves. We tracked units sold and market share to learn about our competitive position. Our team was surprised that market share monitoring showed our current standing and highlighted new competitors and expansion opportunities.
Revenue growth tracking helped us direct resources to high-potential regions and products. We found several underperforming SKUs that masked our core product line’s success after implementing these financial KPIs.
Operational efficiency metrics
Inventory turnover became a revolutionary force in our CPG financial model. This metric showed our inventory’s sale and replacement frequency over specific periods. Our turnover rate fell below industry average, so we implemented just-in-time inventory systems that cut holding costs by nearly 20%.
Gross margin tracking showed which products made the most profit after production costs. This knowledge helped us optimize manufacturing processes and raise prices on select items.
Customer and loyalty metrics
Customer retention metrics changed our consumer relationship approach. We calculated retention rates to find products that created genuine loyalty. Net Promoter Score (NPS) surveys helped us measure customer advocacy and spot potential brand detractors.
Increasing Customer Lifetime Value (CLTV) by just 5% led to a 25% boost in overall revenue through repeat purchases and word-of-mouth referrals.
Marketing and trade spend metrics
Trade spend efficiency became the core of our finance CPG strategy. We measured promotional lift compared to base sales. We also calculated Return on Advertising Spend (ROAS) in all channels.
Customer Acquisition Cost (CAC) tracking completed our financial KPI dashboard and helped us create an informed marketing organization.
How We Set and Aligned KPIs Across Departments
CPG financial metrics alignment across departments became vital to achieve cohesive business results. Teams worked in isolation and optimized different outcomes, which sometimes hurt overall brand performance.
Translating business goals into measurable KPIs
Our executive team set clear organizational objectives to start the process. We made each KPI SMART—Specific, Measurable, Achievable, Relevant, and Time-bound before implementation. This approach removed any confusion and helped everyone understand our targets.
We broke down broad goals into department-specific objectives. Our goal to increase market share by 5% year-over-year translated into specific targets for sales, marketing, and operations teams. The team moved from unclear aspirations to concrete numbers that everyone could support.
Collaborating with sales, marketing, and finance teams
Cross-functional collaboration became the life-blood of KPI alignment. We created shared KPIs that required teams to work together. Marketing teams stopped focusing only on brand awareness while sales chased revenue targets. Instead, we developed overlapping metrics that encouraged teamwork.
“Collaborative dashboards” marked a major breakthrough. Each department could see how their KPIs impacted others. This transparency solved a common issue where “different departments often are all working towards different KPIs”.
Using ERP tools to centralize data
Enterprise resource planning (ERP) system implementation reshaped our core business processes into one detailed platform. The centralized database gave all departments access to consistent information. This is a big deal as it means that we reduced the “need for redundant data reconciliation”.
The ERP system helped our finance CPG team especially when tracking real-time progress against goals. It measured performance against industry standards and updated forecasts automatically. This technology made our financial KPI framework sustainable rather than a one-time project.
Better business decisions that drove tangible results proved more valuable than just having aligned financial KPIs.
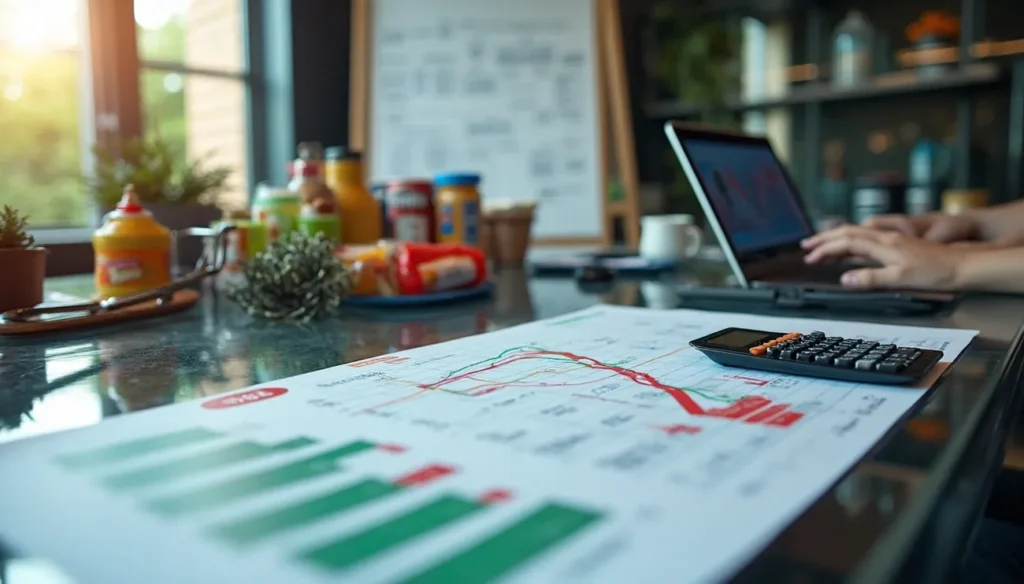
Lessons Learned from Tracking KPIs Over 12 Months
The results were eye-opening after we tracked our cpg financial metrics for a full year. Our systematic approach gave us analytical insights that revolutionized our tactical operations and strategic direction.
What worked: quick wins and long-term gains
The Cash Conversion Cycle (CCC) became our most meaningful financial KPI. This liquidity indicator helped us handle the unique cash flow challenges CPG companies face, such as extended retailer payment terms and high inventory costs. We broke down CCC into its components—Days Sales Outstanding, Days Payable Outstanding, and Days Inventory Outstanding. This gave us clear visibility into areas that needed improvement.
Promotional lift measurement also delivered exceptional value. We separated incremental volume from non-incremental volume to determine which retailer promotions accelerated growth. This approach helped us identify underperforming trade spending and reallocate resources quickly.
What didn’t: metrics that misled us
Some metrics painted a false picture of our business health. Net profit looked promising at first but misled us because it didn’t reflect our available cash accurately. Top-line revenue—a lagging indicator—didn’t tell us much about future performance.
We stopped using Customer Lifetime Value (LTV) calculations in our investor presentations. One document stated, “LTV is highly subjective and doesn’t provide investors with much concrete information about your startup’s financial future”.
How we adjusted our CPG financial model
Our company moved from quarterly budgeting cycles to continuous budget cycles with rolling forecasts. This standard industry practice let us plan more responsively as market conditions changed.
The team implemented scenario planning that combined short-term forecasts (1-2 years) based on internal data with long-term projections (3-5 years) from market-level analysis. The model stayed flexible and adapted quickly when conditions changed.
The role of real-time dashboards in decision-making
Live dashboards changed our decision velocity fundamentally. Research shows executives spend nearly 40% of their time making decisions, which makes dashboard efficiency vital.
Our dashboard focused on three core metrics that every CPG company watches closely: Distribution (% ACV), Out-of-Stock rate, and Share of Shelf. These metrics appeared prominently with color-coded alerts whenever they fell below target thresholds.
The dashboards solved the common problem of data silos and allowed different departments to work from a single source of truth.
Conclusion
Our CPG brand’s performance revolutionized when we started tracking financial KPIs last year. We used to rely on instinct instead of solid data to make decisions. Now we work with confidence because we have useful information from our four main metric categories.
Cash Conversion Cycle became our most valuable metric and gave us a clear view of our liquidity position. Our ERP systems centralized data that broke down departmental barriers to create a single source of truth. This shared foundation helped arrange sales, marketing, and operations teams toward common goals instead of competing priorities.
We faced some tough challenges despite our progress. Net Profit and Customer Lifetime Value metrics ended up misleading us in our specific business context. We adapted our financial model with rolling forecasts and scenario planning to stay flexible as market conditions changed.
Live dashboards became crucial tools that helped us make quick decisions. We focused on distribution, out-of-stock rates, and share of shelf metrics to spot retail performance issues before they hurt our bottom line.
Financial KPIs might not excite people like new product launches or creative campaigns do. Yet they are the foundations for eco-friendly growth. My experience shows that CPG brands who invest in strong financial tracking gain a clear edge over competitors. These 12 months mark just the start of our informed transformation—one that keeps paying off as we grow our brand in this challenging industry.